Logilens
A desktop dashboard that turns a sprawling B2B sales funnel into one readable flow.
Overview
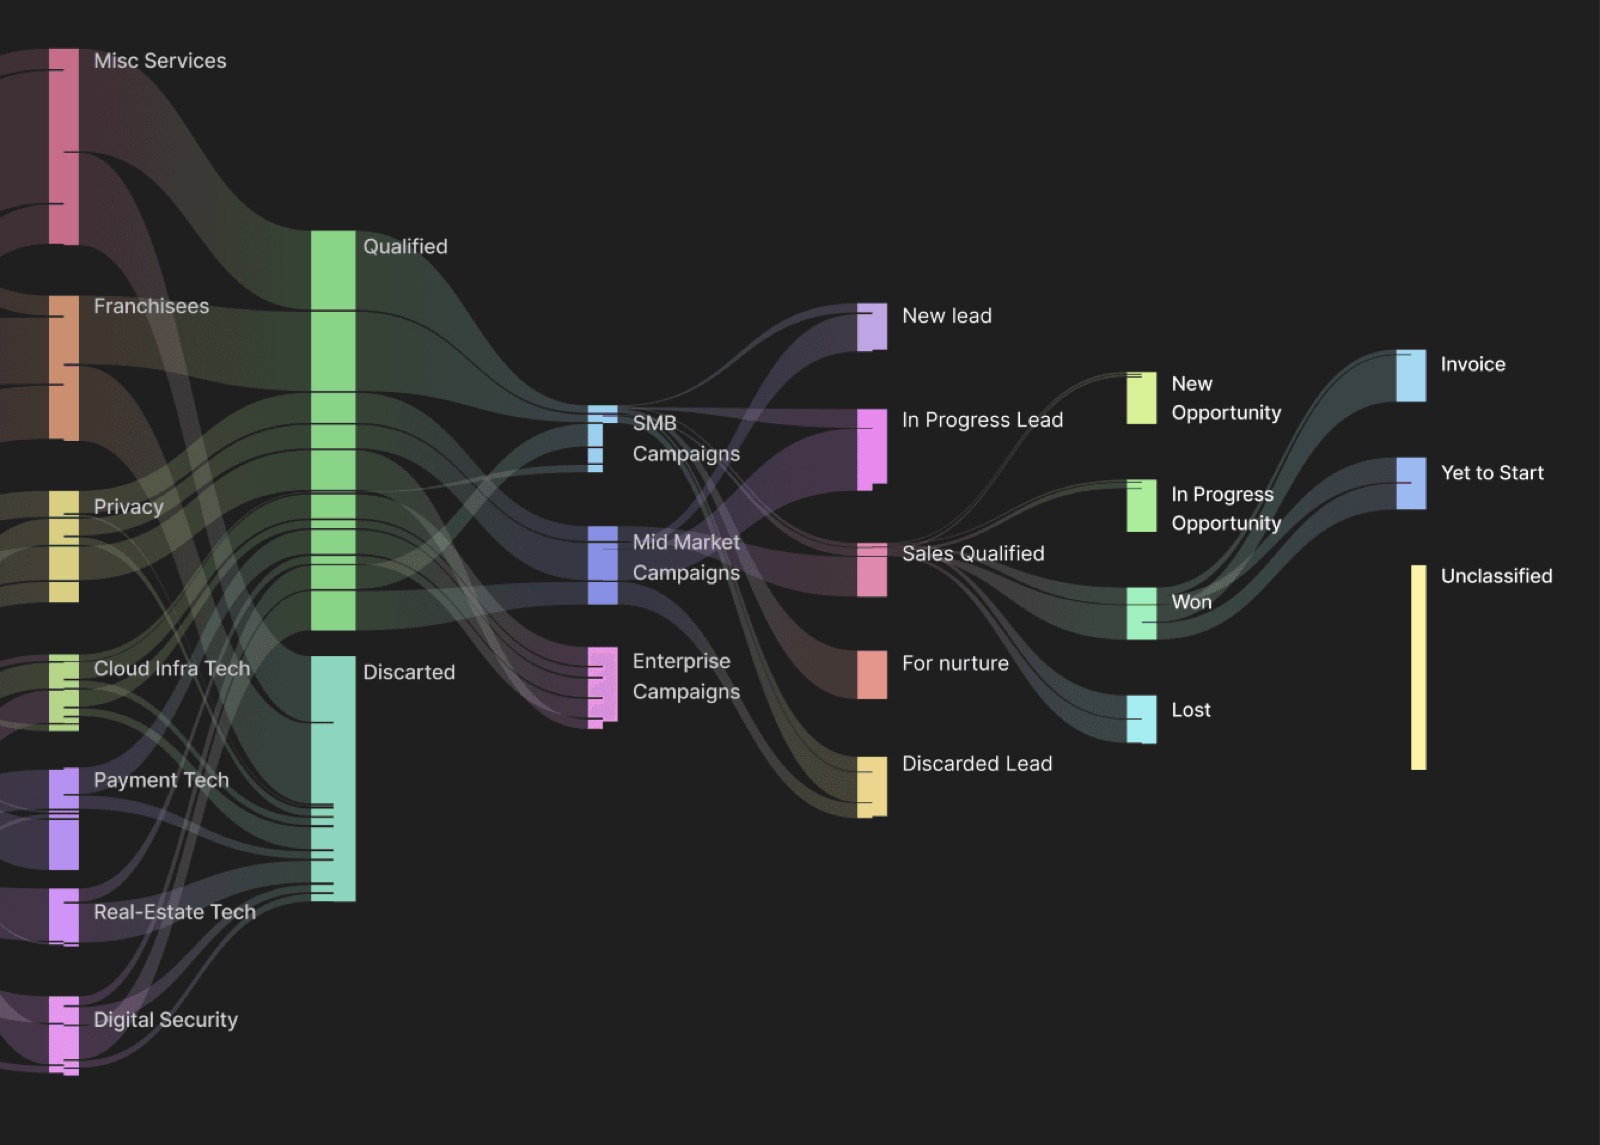
Logilens needed to see how leads actually moved — in from seven sources (misc services, franchisees, privacy, cloud infra tech, payment tech, real-estate tech, digital security), through qualification and campaign type, out the other side as won, lost, invoiced or still in play. I designed an interactive Sankey-style flow view that holds all of that on one screen without collapsing into noise, plus the filtering model underneath it for drilling into any single stage.
One-screen funnel
Source, qualified or discarded, campaign tier (SMB, mid-market, enterprise), lead stage and final outcome — in a single flow diagram instead of five separate reports.
Drill in, don't drown
An interaction model for isolating one path — say, enterprise campaigns through to invoice — without losing the shape of everything else.
Built for daily use
A desktop-first layout sized for a sales ops team that opens this screen every morning, not once a quarter.
“The final design prototype was working amazing. He really have great design skills. Loved working with him.”
Have a flow people keep abandoning?
Book a 30-minute call. If it's a fit, the next step is a five-day teardown.
Book a flow teardown →